Introduction to Bollinger Bands
Bollinger Bands is a popular technical analysis tool developed by John Bollinger in the 1980s. It consists of a moving average (typically a 20-period SMA) and two standard deviation bands above and below it. These bands dynamically adjust to market volatility, helping traders identify potential overbought and oversold conditions, as well as trend strength.
Components of Bollinger Bands
- 1.Middle Band (20-period Simple Moving Average - SMA)
- Represents the average price over the last 20 periods.
- 2.Upper Band (SMA + 2 Standard Deviations)
- Indicates potential resistance levels.
- 3.Lower Band (SMA - 2 Standard Deviations)
- Indicates potential support levels.
How to Use Bollinger Bands in Trading:
- 1.Identifying Overbought & Oversold Conditions
- When the price touches the upper band, the market may be overbought (potential sell signal).
- When the price touches the lower band, the market may be oversold (potential buy signal).
- If a stock price hits the upper band and shows reversal patterns (like a bearish candlestick), traders may consider selling.
- Conversely, if the price touches the lower band and shows bullish signals (like a hammer candlestick), traders may consider buying.
- 2.Bollinger Squeeze (Low Volatility)
- When the bands contract, it indicates low volatility and a potential breakout.
- Traders watch for a breakout above or below the bands to enter trades in the direction of the breakout.
- 2.Trend Confirmation
- If the price stays near the upper band, it suggests a strong uptrend.
- If the price stays near the lower band, it suggests a strong downtrend.
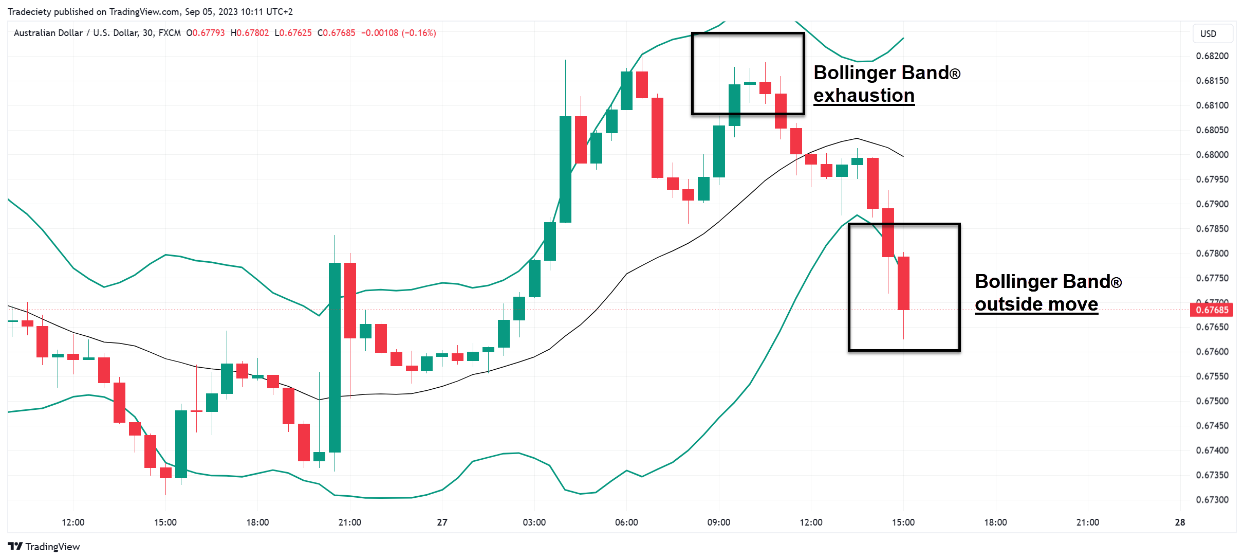
Example of Bollinger Bands in Action
Let’s take a BTC/USD chart as an example:
- 1.Overbought Signal:
- BTC price touches the upper band → RSI also shows overbought (>70) → Price reverses downward.
- 2.Oversold Signal:
- BTC price touches the lower band → RSI shows oversold (<30) → Price bounces upward.
- 3.Bollinger Squeeze:
- Bands narrow → Breakout occurs → Price surges upward.
Limitations of Bollinger Bands
- Works best in ranging markets; in strong trends, prices can stay near the bands for extended periods.
- Should be used with other indicators (like RSI, MACD) for better accuracy.
Conclusion
Bollinger Bands are a powerful tool for traders to gauge volatility, identify potential reversals, and confirm trends. By combining them with other technical indicators, traders can improve their decision-making process.