Track Key Financial Indicators
Stay ahead in the market with real-time insights and data-driven analysis.
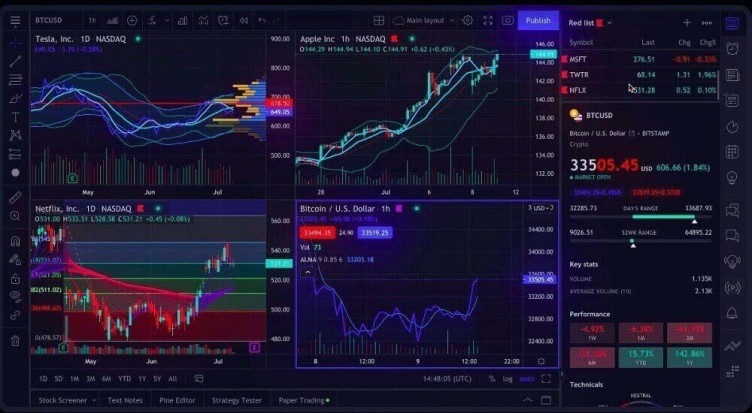
What are Forex Indicators?
Forex trading indicators are analytical tools that help traders assess market trends, price movements, and trade decisions. These mathematical computations, based on price, volume, or other data, provide visual representations of market conditions. Indicators are categorized into leading, which predict future price changes, and lagging, which confirm existing trends.
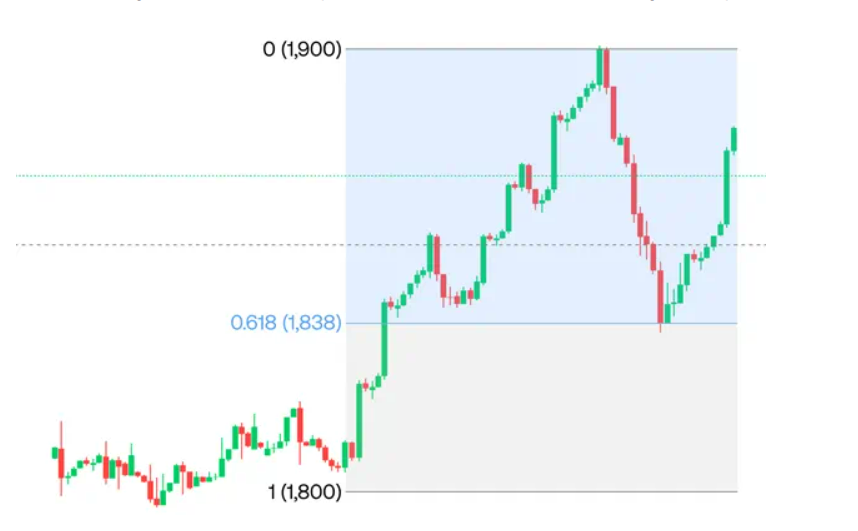
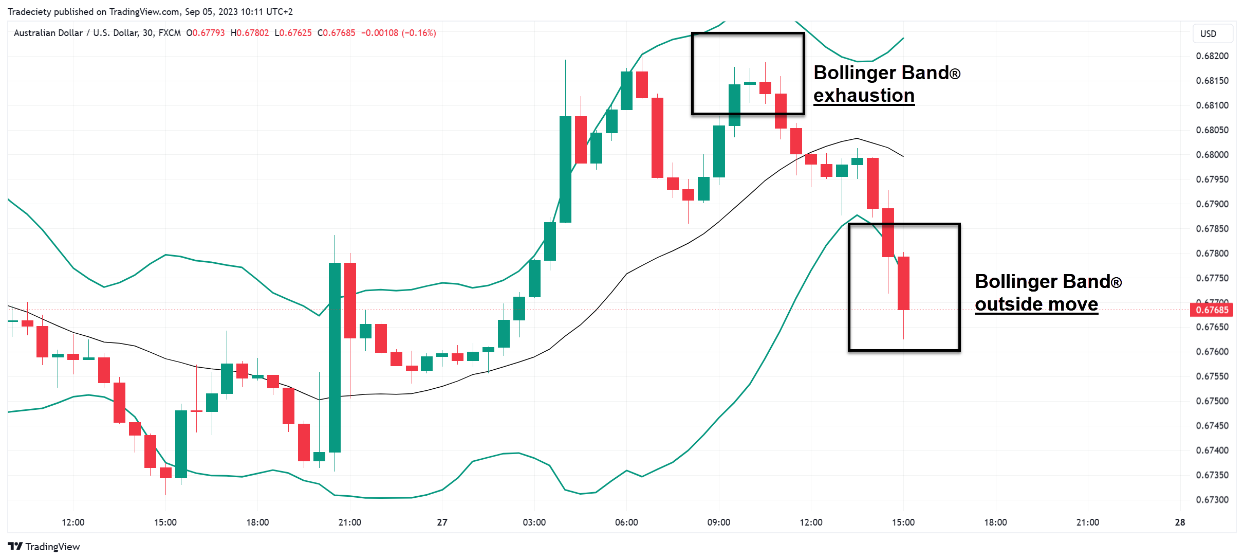
Key categories include trend indicators like Moving Averages and Ichimoku Cloud for market direction, momentum indicators like RSI and MACD for strength analysis, and volatility indicators like Bollinger Bands for risk management. Volume indicators, such as VWAP, validate trends, while pivot points and Fibonacci retracement help identify potential reversal levels for entry and exit strategies.
How to use Forex technical indicators
Learn the Characteristics of Indicators
Understand the basics of each indicator, including what it measures and how it responds to market conditions.
Select Indicators
Choose indicators that align with your trading strategy and the market conditions you are analyzing.
Customize Indicator Settings
Adjust indicator settings to optimize their effectiveness for your trading
approach.
Consider Market Conditions
Some indicators perform better in trending markets, while others work well in range-bound conditions.
Analyze the Charts
Observe how indicators interact with price charts, looking for patterns, divergences, and signals.
Test Your Strategy
Backtest your strategy using historical data to evaluate its effectiveness and identify areas for improvement.
Main Forex indicators for trading
Popular and effective combinations of indicators are as follows:
1. Moving Averages + RSI
2. MACD + Fibonacci
3. Bollinger Bands + Stochastic
4. ADX + Moving Averages
5. Price Action + Volume
Enhance Your Trading Strategy
Gain insights and improve your trades with technical indicators.