Introduction to Fibonacci Retracement
The Fibonacci retracement tool is a popular technical analysis indicator used by traders to identify potential support and resistance levels based on key Fibonacci ratios. Derived from the Fibonacci sequence, these levels (23.6%, 38.2%, 50%, 61.8%, and 78.6%) help traders predict where price corrections may end before the trend resumes.
How Fibonacci Retracement Works
Fibonacci retracement levels are drawn between a swing high and a swing low (or vice versa) in a trending market. The tool then plots horizontal lines at key percentages, indicating where price pullbacks may find support or resistance.
Key Fibonacci Levels
- 23.6% - Shallow retracement, common in strong trends.
- 38.2% - Moderate retracement, often seen in healthy trends.
- 50%- - Not a true Fibonacci number but widely used as a psychological level.
- 61.8%- The "Golden Ratio," a critical level where trends often reverse or continue.
- 78.6% - Deep retracement; if broken, the trend may reverse.
How to Use Fibonacci Retracement in Trading
- 1. Identifying Retracement Levels in an Uptrend
- Step 1: Locate a clear swing low (A) and swing high (B).
- Step 2: Draw Fibonacci retracement from point A to B.
- Step 3: Watch for price reactions near 38.2%, 50%, or 61.8% for potential buying opportunities.
Example
If a stock rises from 100to100to200 and then pulls back, traders watch for support at:
- 2.Identifying Retracement Levels in an Uptrend
- $176.40 (23.6% retracement)
- $161.80 (38.2% retracement)
- $150 (50% retracement)
- $138.20 (61.8% retracement)
- 3.Identifying Retracement Levels in a Downtrend
- Step 1: Locate a swing high (A) and swing low (B).
- Step 2: Draw Fibonacci retracement from point A to B.
- Step 3: Watch for resistance near 38.2%, 50%, or 61.8% for potential selling opportunities
- 4.Combining Fibonacci with Other Indicators
- RSI or MACD: Confirms overbought/oversold conditions.
- Moving Averages: Helps validate trend strength.
- Candlestick Patterns: Engulfing, Doji, or Hammer patterns near Fib levels add confirmation.
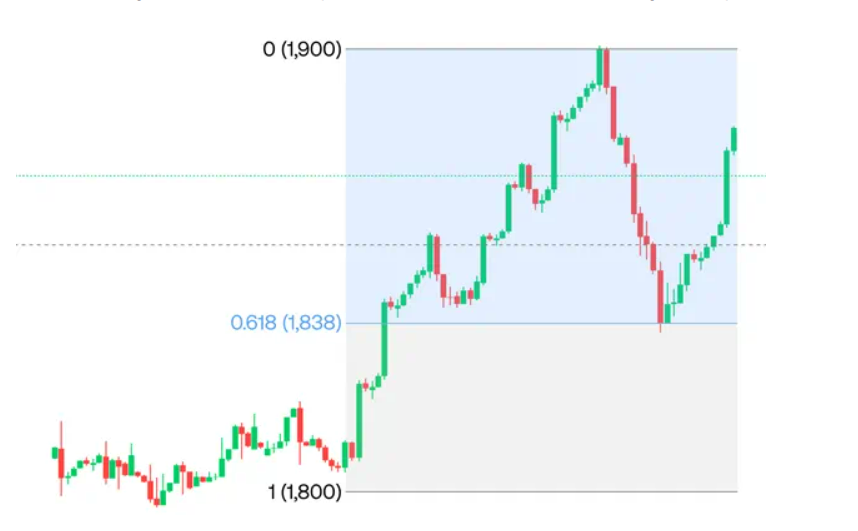
Example of Fibonacci Retracement in Action
Let’s take Bitcoin (BTC/USD) as an example:
- 1.BTC rallies from 30,000to30,000to60,000.
- 2.Price retraces and finds support at the 61.8% level (~$42,360).
- 3.The uptrend resumes, confirming the Fibonacci level as a strong support zone.
Limitations of Fibonacci Retracement
- Not always exact-Price may overshoot or undershoot levels.
- Works best in trending markets-Less effective in choppy or sideways markets.
- Subjective placement-Different traders may pick different swing highs/lows.
Conclusion
Fibonacci retracement is a powerful tool for identifying potential reversal zones in trending markets. By combining it with other indicators, traders can improve their entry and exit strategies.